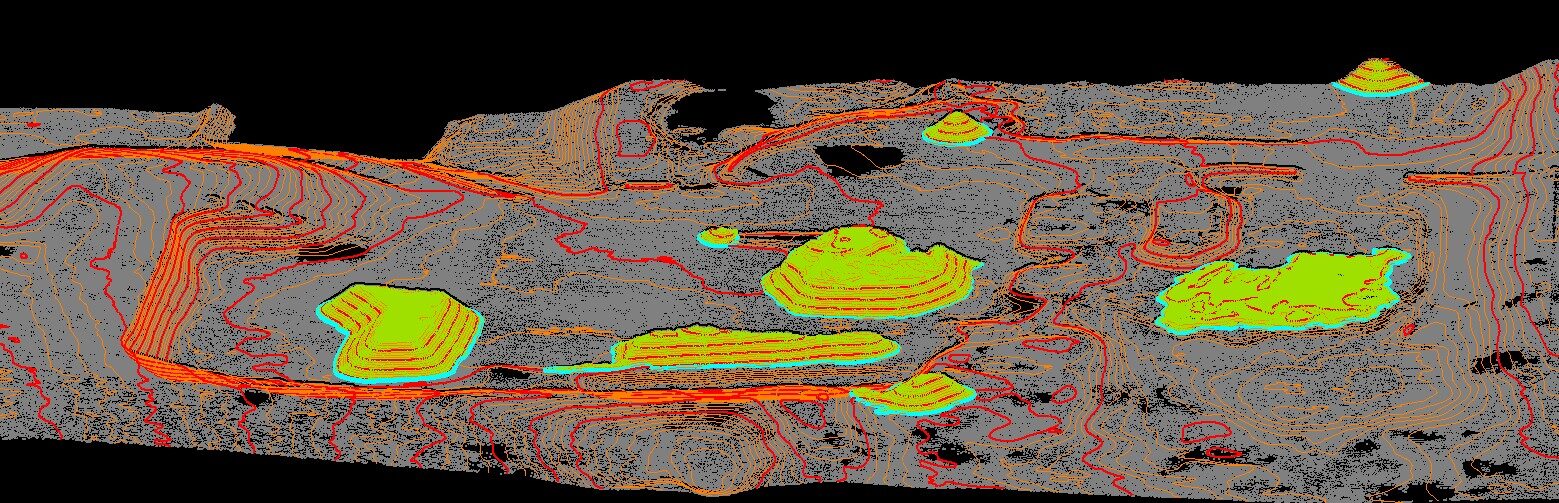
Problem and task.
Data Source: UAV LiDAR scanning
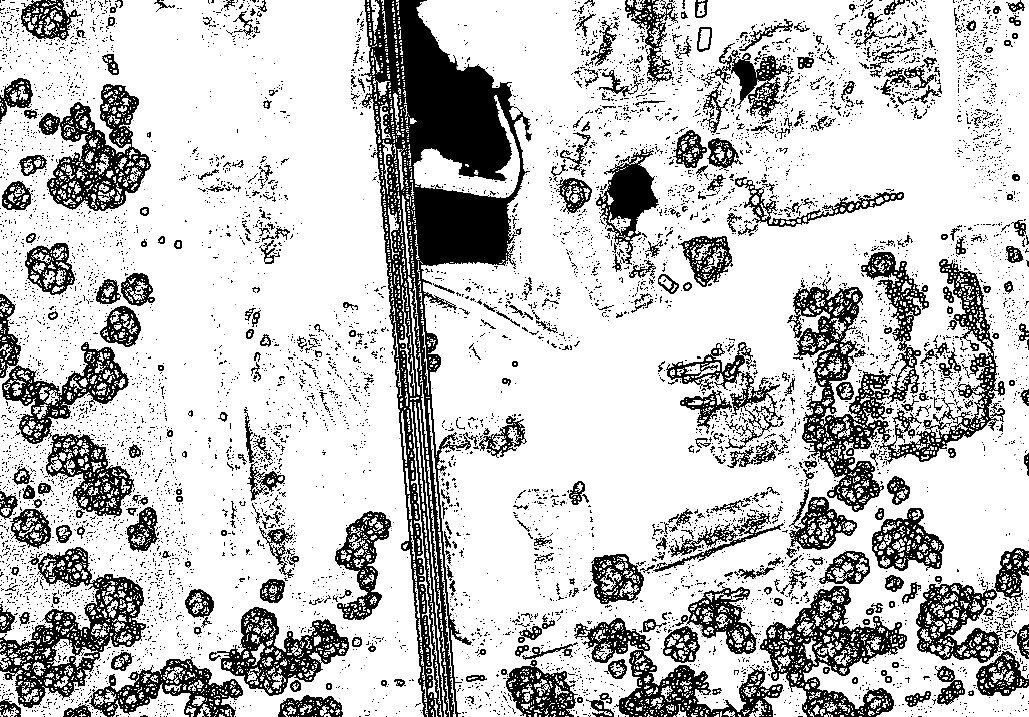
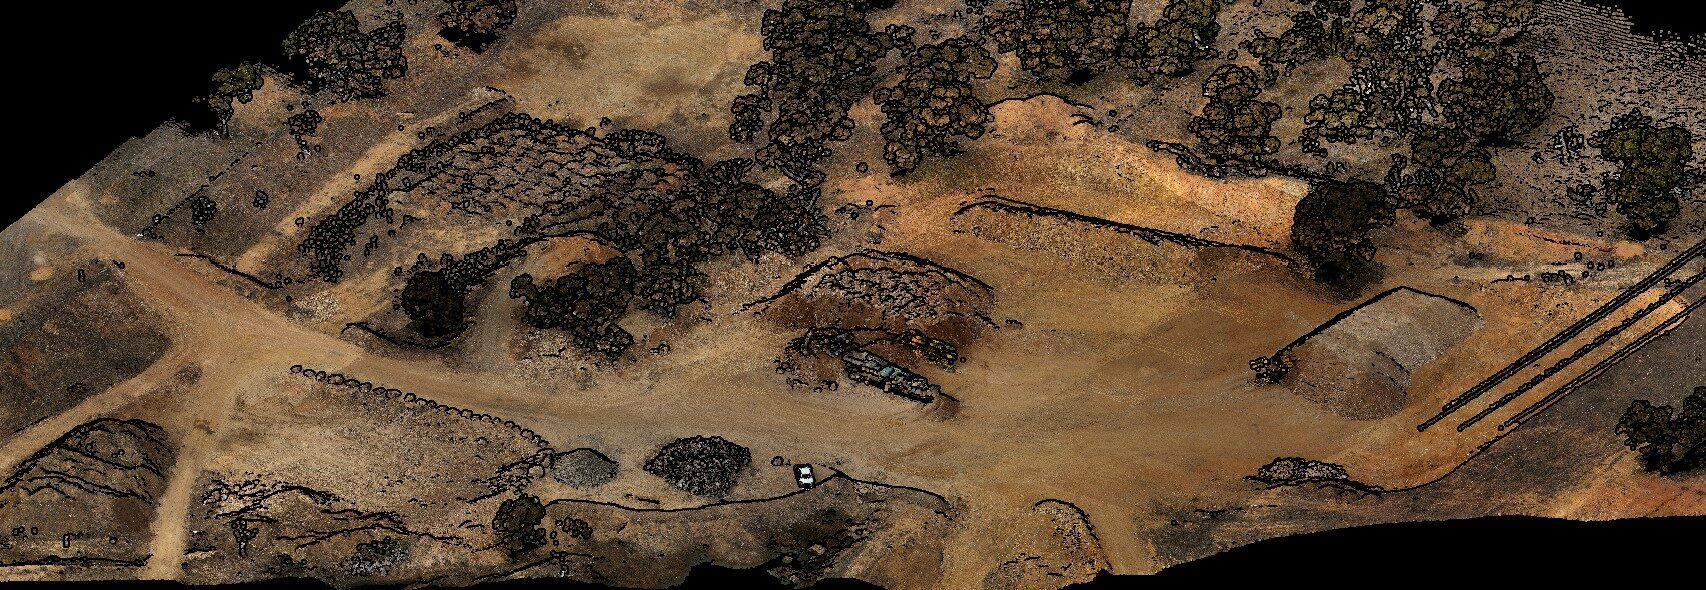
Input: Point Cloud
Challenges and Objectives:
- Objective: Generate contour lines and calculate stockpile volumes based on the point cloud.
- Challenges:
- Generating contour lines with varying intervals.
- Accurately calculating stockpile volumes in cubic meters.
- Ensuring clear identification of each stockpile through color-coded elevation representation and DXF formatting.
Project Requirements:
-
- Deliver output materials as DEM .TIFF model and provide classified point cloud.
- Output file format: DXF, with clear representation of contours and stockpile volumes.
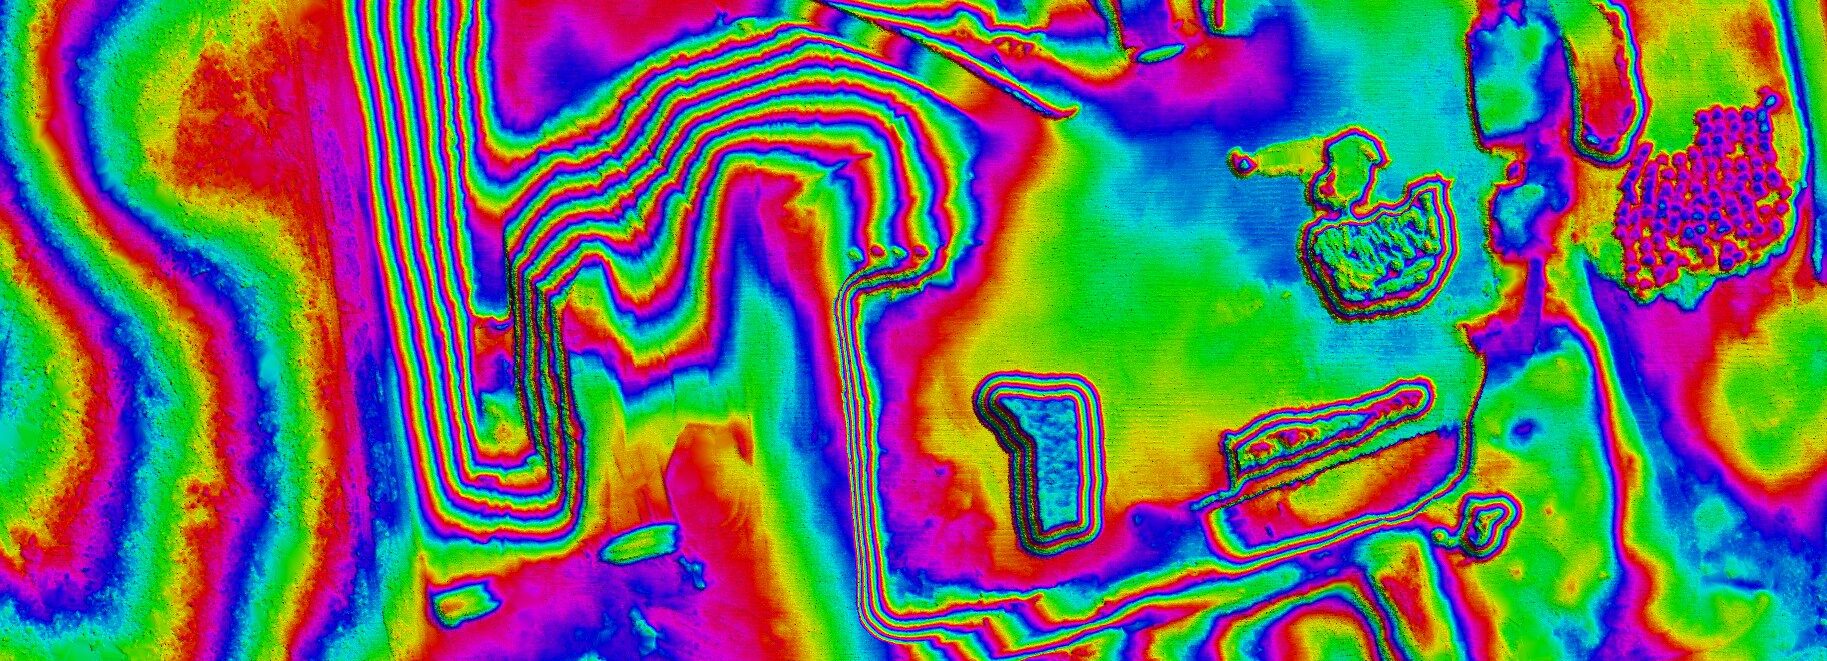
- Use color coding to display elevation distribution.
- Provide detailed volume data for each stockpile.
- Ensure calculation accuracy meets established geodetic standards.
- Contour intervals:
0.25 m – Minor contours
1 m – Major contours
-
- Polylines must be 2D but include elevation data directly on the polyline.
- Extract a raster image in GeoTIFF format covering the entire territory.


Realization.
We utilized Terrasolid software to process LiDAR scanning data, specifically for generating contours and calculating stockpile volumes. We used tools that handle LAS data to nail the topography and crunch the stockpiles’ volumetric calculations. We tapped into a bunch of data processing methods and algorithms to boost accuracy and automate the contour creation.
Stages:
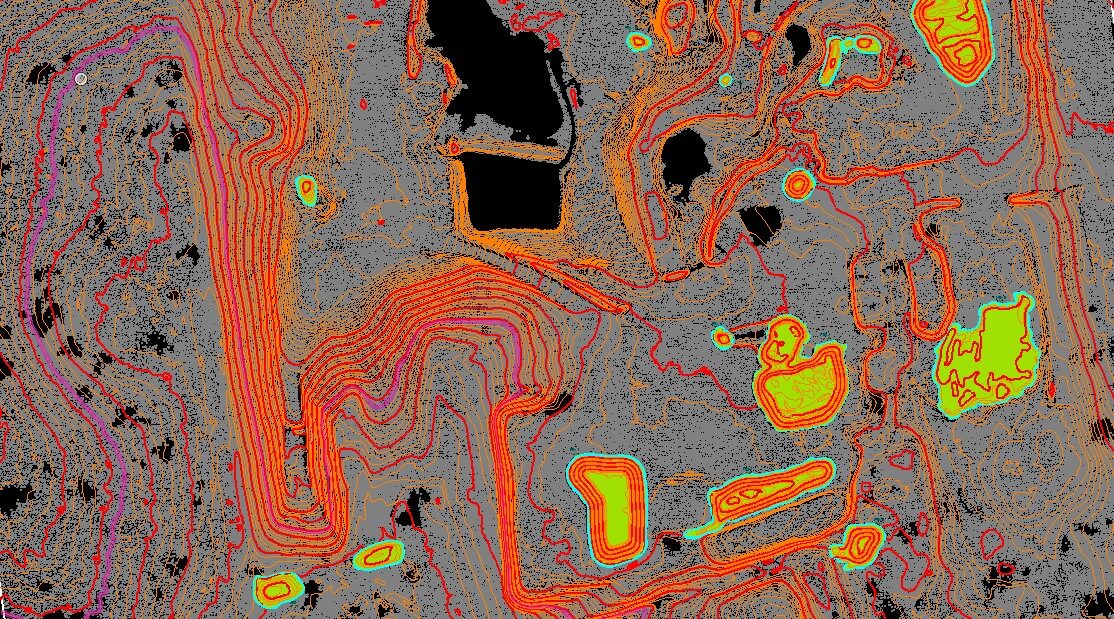
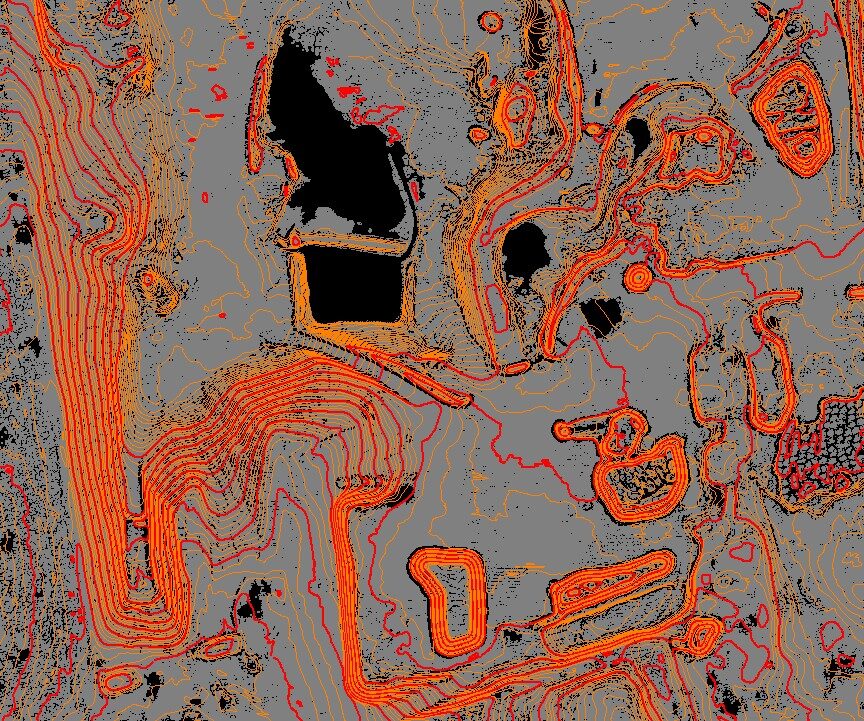
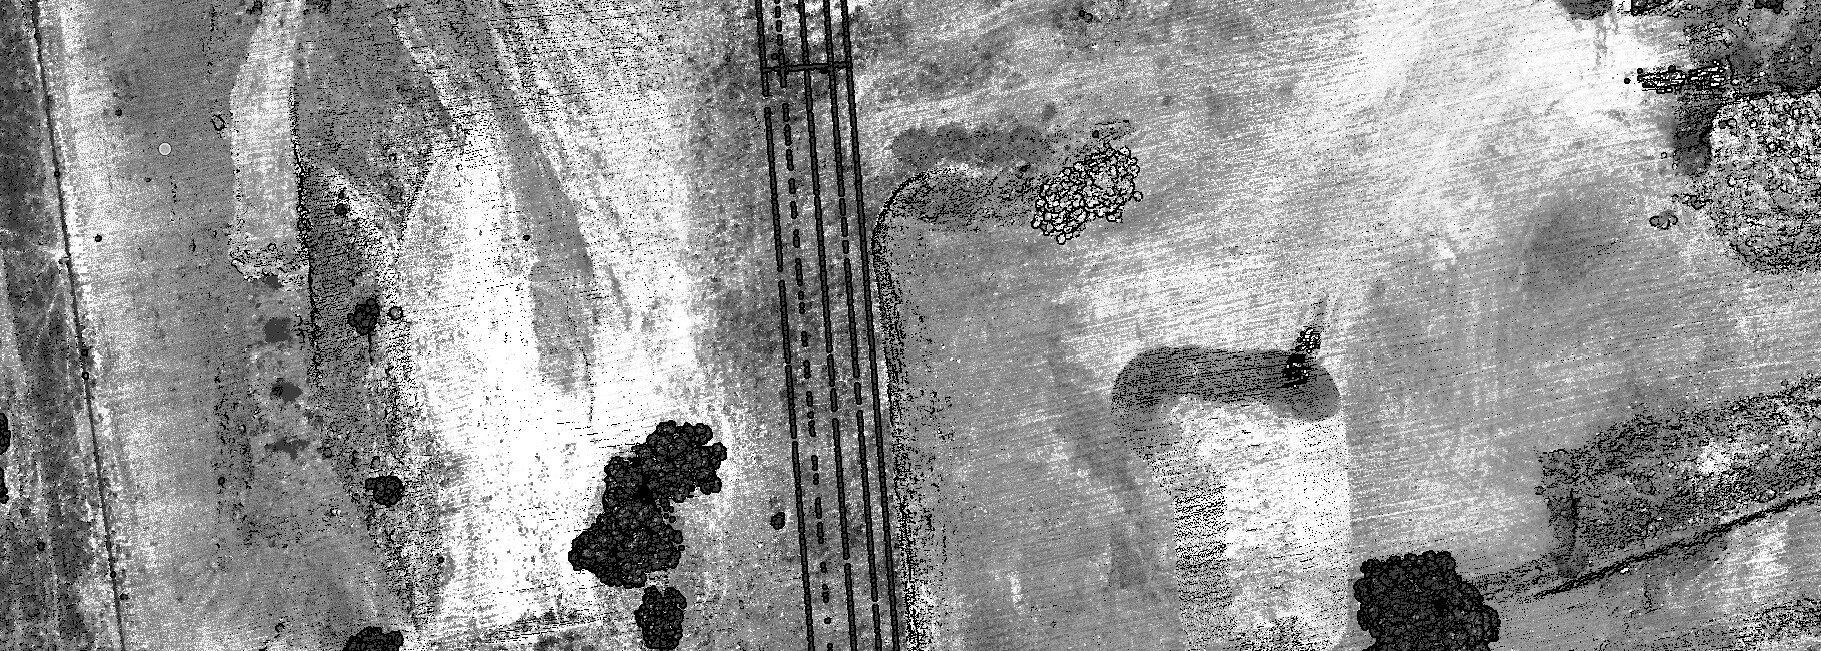
- The team started by processing LiDAR data to separate ground and non ground for contour extracting and piles obtaining. After that we obtained DTM model and work with it to extract a minor and major contour lines from the DTM.
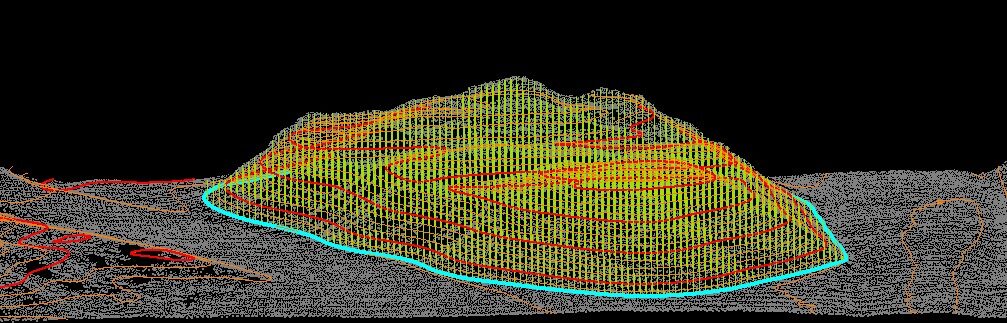
- The team created a digital terrain model(DTM) beneath each stockpile from LAS data to use as a base layer for volumetric modeling.
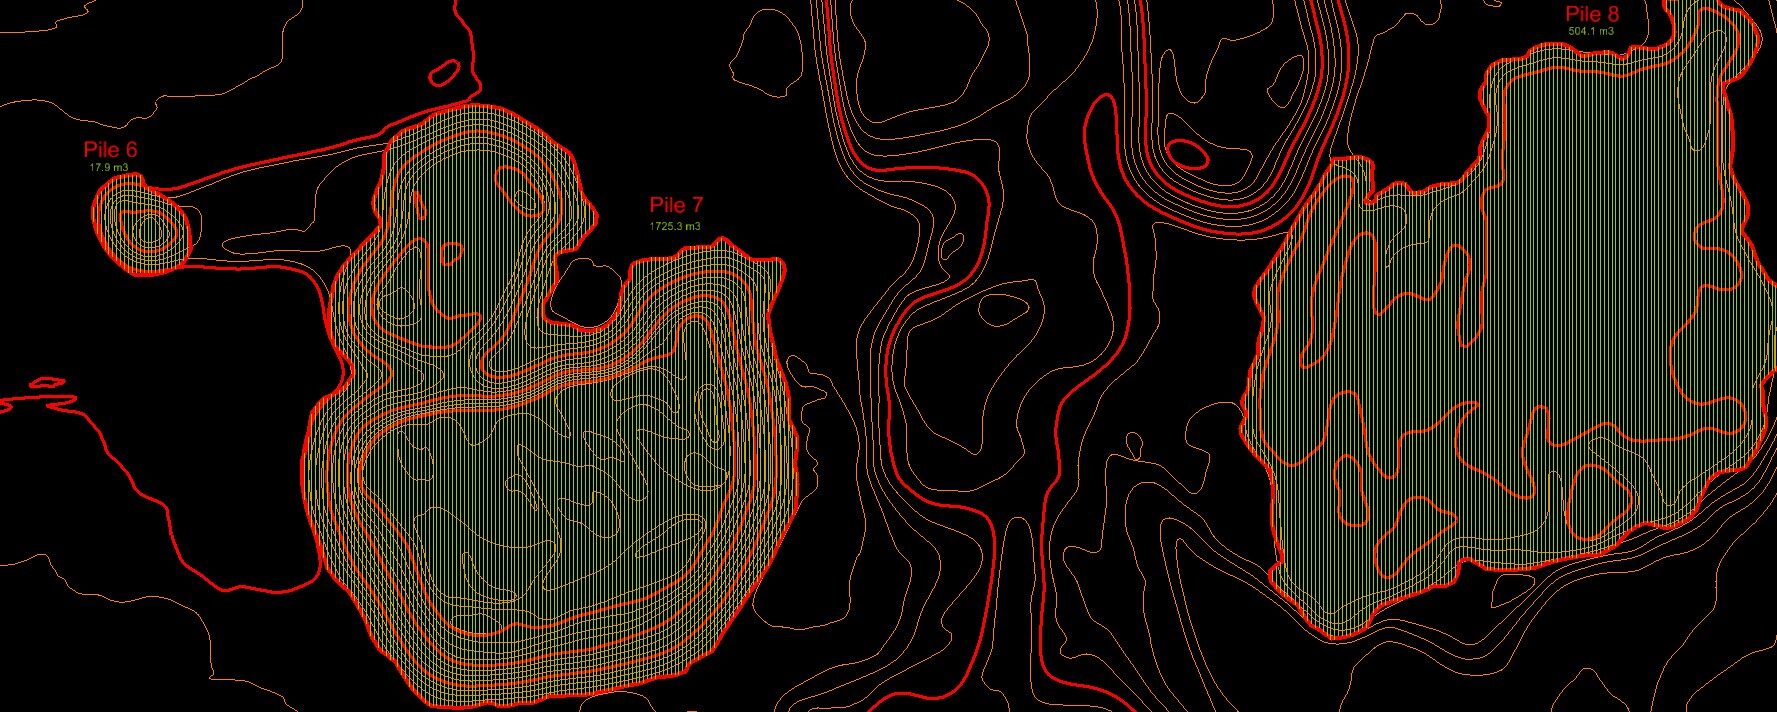
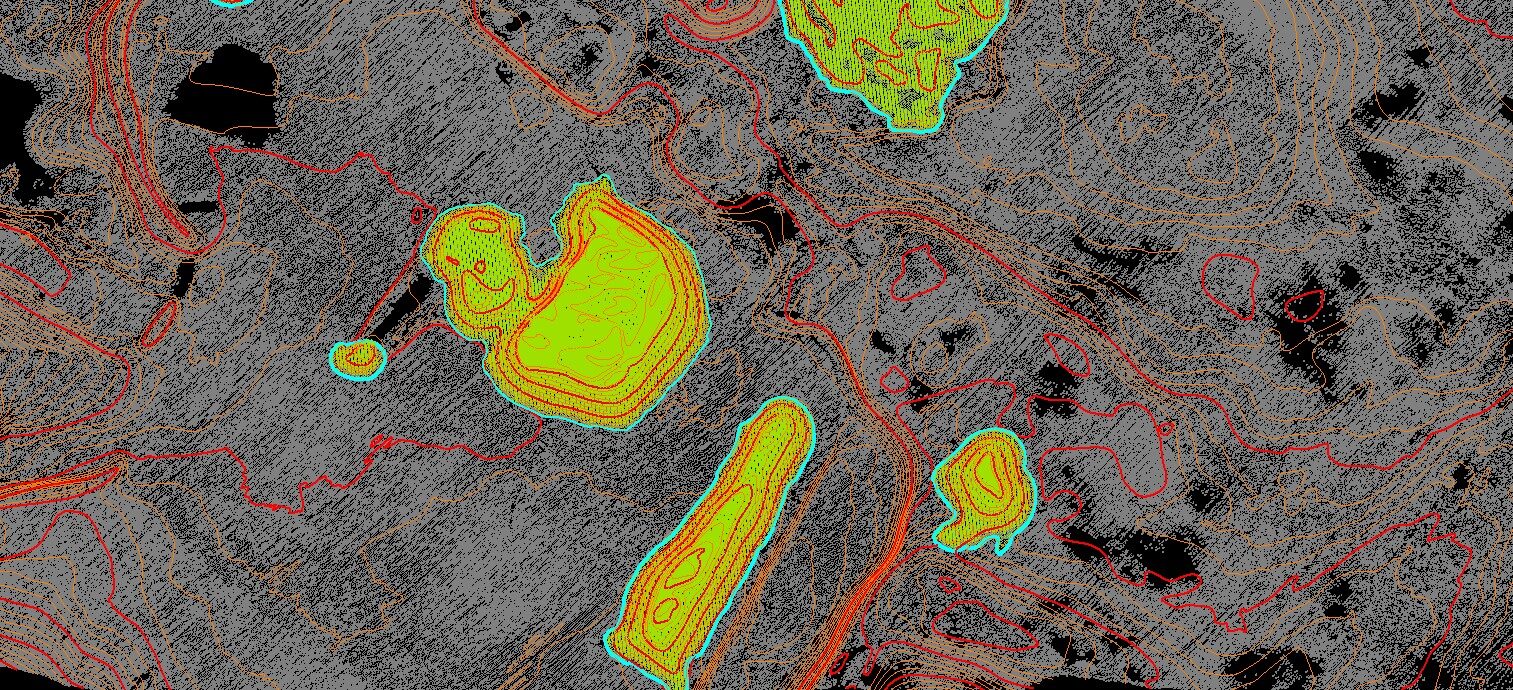
- Using these terrain models, the team built volumetric models of the stockpiles, applying green elevation-based color coding to clearly define boundaries.
- During volume calculations, engineers verified the Digital Terrain Model (DTM) classification to ensure high accuracy. Color coding facilitated easy identification of each stockpile and its volume.
- The team exported stockpile volumes into vector data.
- The team added all annotations and labels.
- In the final stage, the team HMARA conducted a quality check, refined volume boundaries, and corrected any inaccuracies. We then compiled all contours and volumes into a single file and delivered it to the client in a .DXF format
Look over our other projects here:
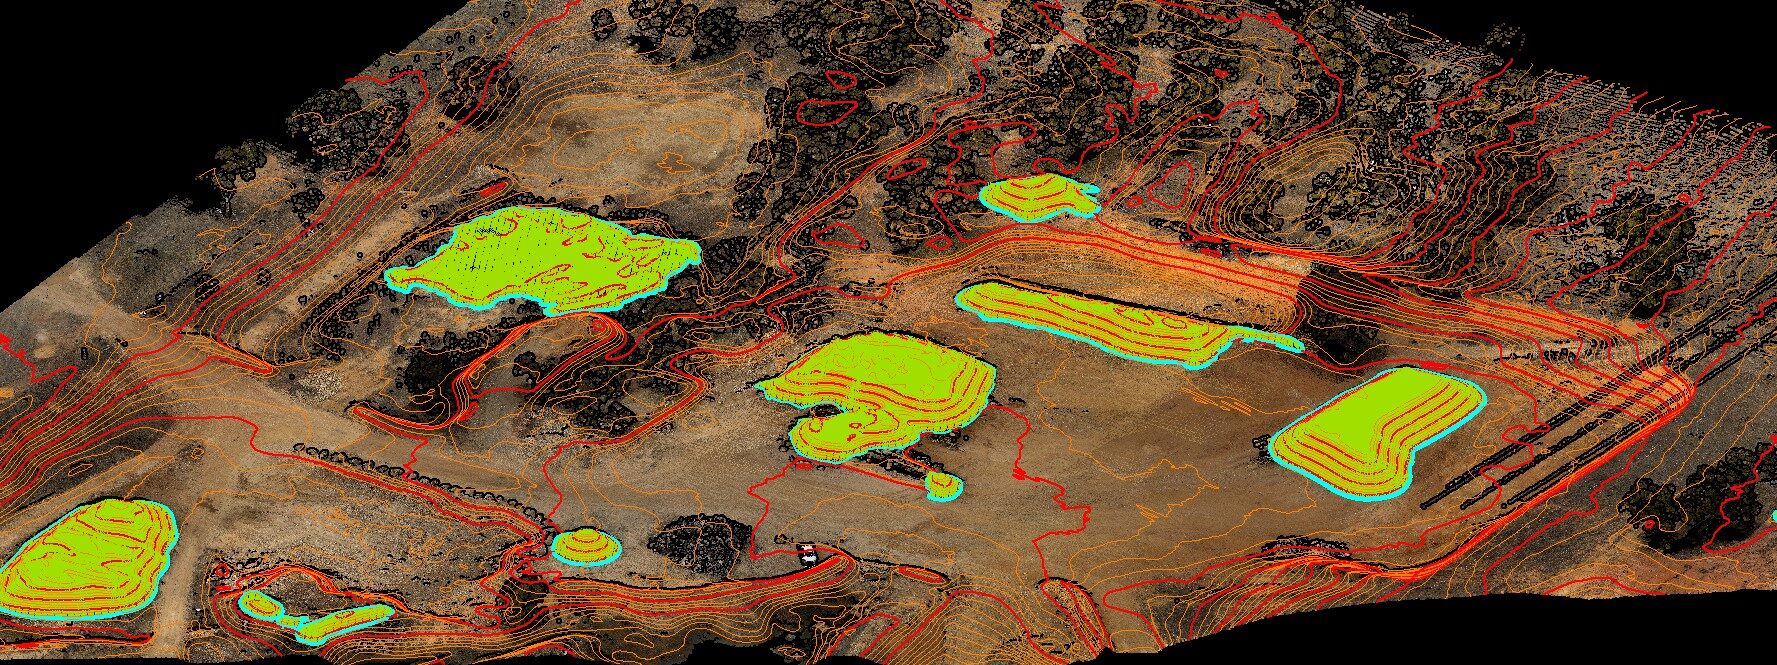




Individual Stockpile Volumes:
| Pile Number | Volume (m³) |
| Pile 1 | 81.7 |
| Pile 2 | 54.9 |
| Pile 3 | 1746.9 |
| Pile 4 | 733.4 |
| Pile 5 | 195.7 |
| Pile 6 | 17.9 |
| Pile 7 | 1725.3 |
| Pile 8 | 504.1 |
| Pile 9 | 82.5 |
| Pile 10 | 1442.5 |
| Pile 11 | 15.2 |
| Pile 12 | 1.6 |
| Pile 13 | 31.1 |
| Pile 14 | 2.3 |
| Pile 15 | 12.0 |
| Pile 16 | 16.2 |
| Pile 17 | 53.4 |
| Pile 18 | 50.3 |
| Pile 19 | 21.4 |
This table organizes the stockpile numbers and their corresponding volumes in cubic meters (m³) in a clear and structured format.

Result.
The project was successfully completed thanks to specialized software for processing LiDAR data, enabling the creation of high-precision stockpile contours and accurate volume calculations. Advanced data processing techniques and automation algorithms yielded the following outcomes:
High-Quality Contour Generation. Using intervals of 0.25 m for minor lines and 1 m for major lines, we saved contours in DXF format with color coding, ensuring clear and comprehensible topographic data representation.
Accurate Volume Calculation. Volumetric models of stockpiles were developed with elevation-based color coding, and the data was exported into vector formats.
Quality Control. Detailed data validation was performed at every stage, using color coding to ensure precise stockpile identification and minimize errors.
Stockpile Statistics and Volumes:
- Total Volume: 6,788.4 m³
- Number of Stockpiles: 19
- Project Completion Time: 1 day
Unique Aspects
The project stood out due to its high-precision LiDAR data processing and efficient process automation, allowing all contours and volumes to be compiled into a single, convenient file for the client. Experience with various data formats and quality assurance methods proved invaluable for future advancements in geospatial technology solutions.
Key Reasons for Using These Methods
Calculation Accuracy. LiDAR scanning provides detailed terrain information, enabling precise volume calculations for excavations and stockpiles. This is critical for infrastructure projects where inaccuracies can lead to cost overruns or structural issues.
Planning Efficiency. The data aids engineers and planners in optimizing construction processes, reducing time and costs for earthworks.
Visualization and Analysis. Contour lines enable the creation of clear terrain models, simplifying site analysis and decision-making for object placement.
Quality Control. Comparing processed data with project specifications helps identify deviations and make timely adjustments, ensuring compliance with standards.
The use of modern geodetic technologies, such as LiDAR scanning and digital modeling, is integral to contemporary construction and land resource management. This work resulted in an effective inventory of materials in stockpiles (e.g., sand, soil, or other bulk materials). With precise volume calculations and detailed visualization, the client received comprehensive and reliable information about material quantities and distribution.
We can arrange surveys anywhere, ensuring high-accuracy data for further analysis. We are always open to new challenges and collaboration.
Feel free to reach out to discuss potential projects or opportunities!