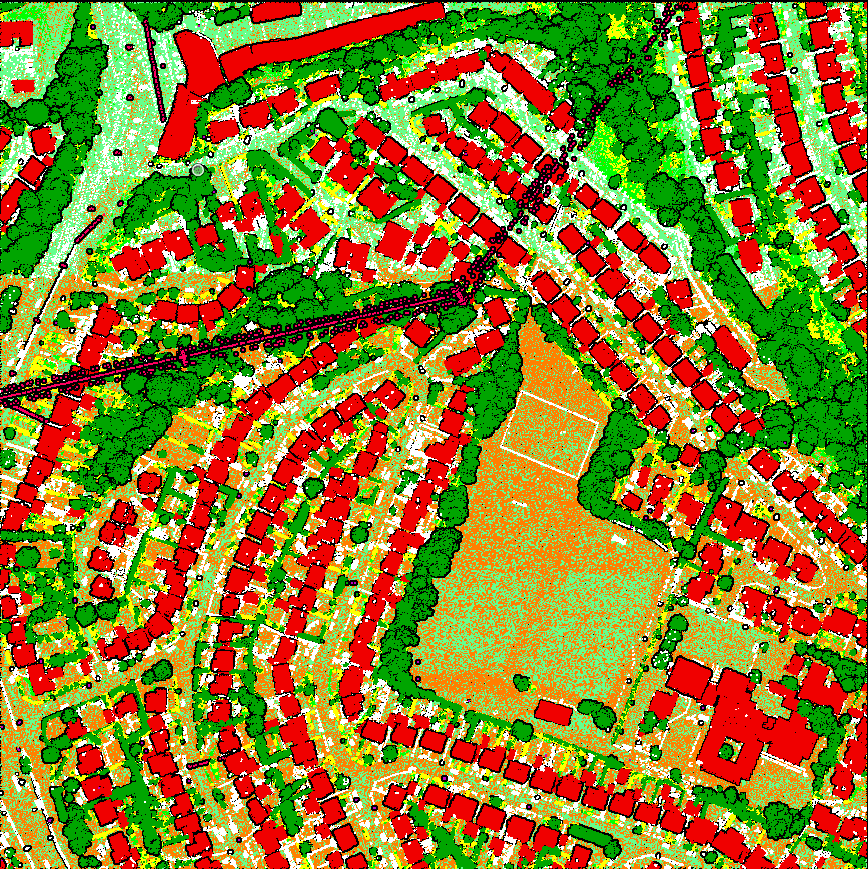
Object territory: Europe.
Average density of scanning: 35 points/m2
Performance specifics:
1.Unclassified
2.Ground
3.Low vegetation 0,1-1m
4.Medium vegetation 1-2m
5.High Vegetation >2m
6.Buildings
7.Low Points / Noise
9.Water surface
14.Powerlines/Masts/etc
17.Bridges
19.Buffer Vegetation 0-0,1m
23.Default
Problem and task.
In fact, in this project, we didn’t have to solve any complex problems or come up with creative solutions. Since the essence of our work is to assist large companies in manual labor, this order was just that. Among the project’s complexities, we can single out the following: dense urban development, which made it impossible to quickly create a relief and move on to classification, high vegetation density near buildings, and the presence of hedges (fences made of vegetation)
Our main task was to perform manual classification of all point clouds according to a certain methodology.
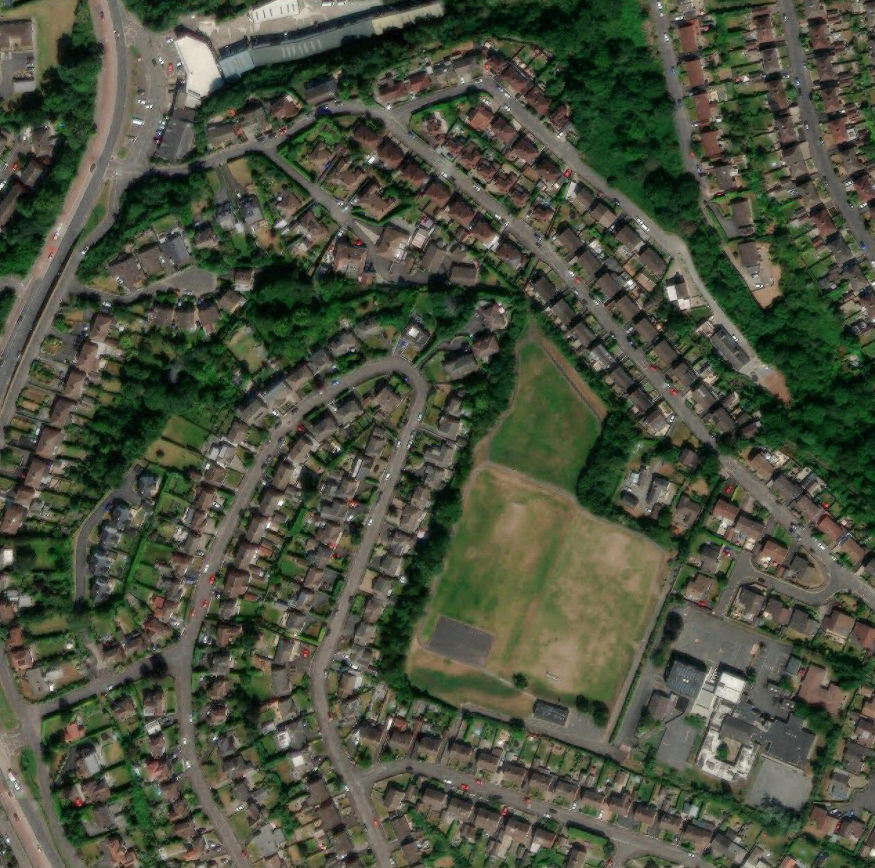
The goal of the project: to create an accurate DEM, classify the area provided by the client according to the project specification. The main difficulty was that the area is densely built-up, as it is in urban districts. The following tasks were set for successful classification.
- Use the data provided by the client.
- Successfully apply the necessary macros in the correct order.
- Do not work with buffer class 19 (Vegetation buffer).
- Clean the buildings of vegetation points, remove building class points from vegetation and other classes.
- Remove all vegetation and other classes not included in the unclassified objects class from class 23 Default. Mainly work on grass fences (hedges). Select the necessary tools to increase the speed of work.
- Classify power line lines in class 1.
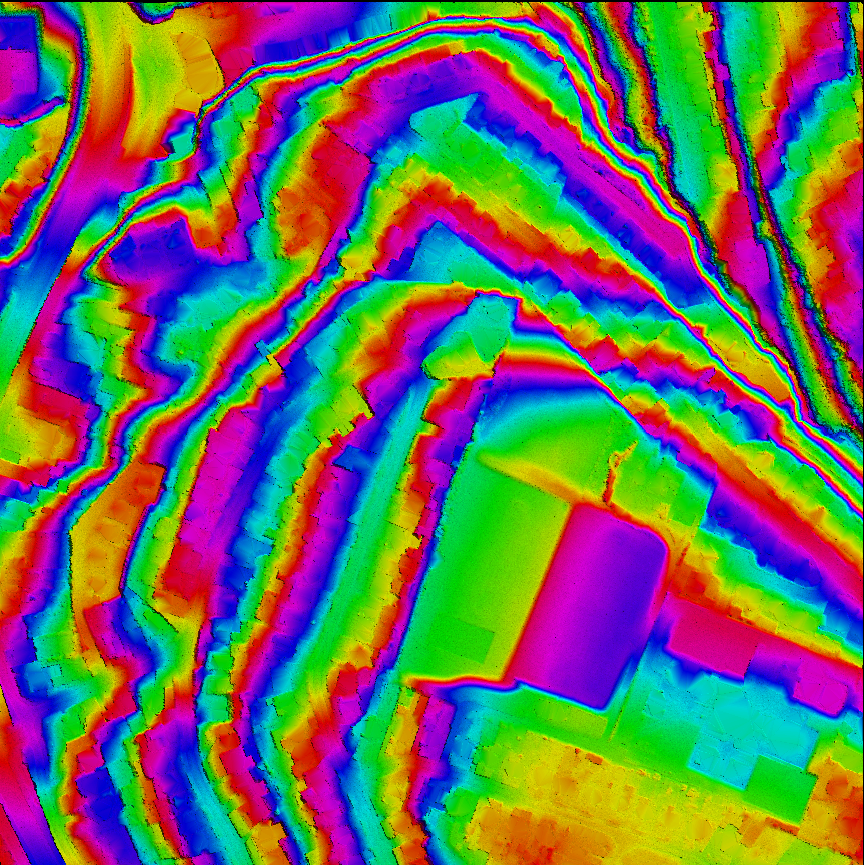
- Create a digital elevation model and improve it to perfection with 10 color cycles.
- After finishing work on the block, combine it at the intersections (power lines, buildings, fences – linear and polygonal objects that can be separated by the border of blocks).
- Apply a macro that will translate from class 23 to class 1 and divide the vegetation according to the height specification.

Realization.
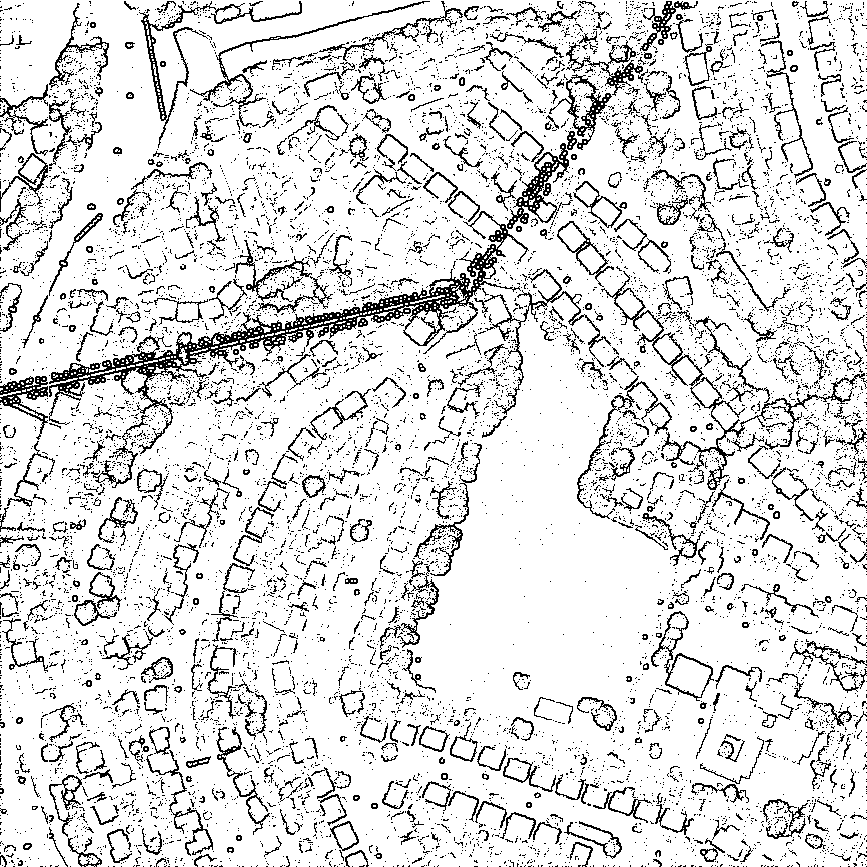
We carry out all work on the classification of laser scanning data and the creation of a digital terrain model in the Bentley Microstation program using the TerraModeler and TerraScan modules. First and foremost, we focused on the high-quality classification of class (6) buildings, as 3D models would be built based on them later. To speed up the work, we turned off all unnecessary classes, leaving only vegetation (3-5) and buildings (6), and began the classification in top view. After that, we worked on power line profiles through cross-sections. The longest task was transferring hedges from class 23 to the vegetation class. To speed up, we also performed this in top view. Creating a digital elevation model in the urban development area was quite challenging due to the large number of buildings. Our team worked with a DTM displaying 10 color cycles to improve accuracy. One of the final steps was applying a macro that converted the necessary classes into vegetation and one unclassified class. After that, the forest strip was cleared from class 1 and individual points were transferred to low points. At this point, the implementation of the LiDAR data classification algorithm was completed.


Result.
After data preprocessing and automatic classification, which divided the point cloud into classes (ground, unclassified and noise), the remaining points were classified manually, according to the technical requirements. A check was performed by loading the classes of land, low points, and water as separate ones. After that, we reflected separately the water and looked at the errors, the ground and low points and looked to see if the power lines were not missed anywhere. Also, all statistics for the file were displayed in a table, which we checked for the absence of extra classes on each las (data block). The work was completed in full and on time.
After processing the laser scanning data and accurate classification, we obtained an accurate digital elevation model and correct points in each data class. After checking the data, we uploaded a list of classes and the number of points to an Excel file and checked for the absence of incorrect erroneous classes. Throughout the project, our team was in constant contact with the client, consulting on the quality of work and completed the project on time, receiving positive feedback. If you would like to discuss a project with us, please get in touch.
We have the capacity to process over 1,000 km monthly. We’re continuously open to new projects and opportunities. Please consider sending us a pilot project to evaluate the quality of our services. Don’t hesitate to drop us a message right here.