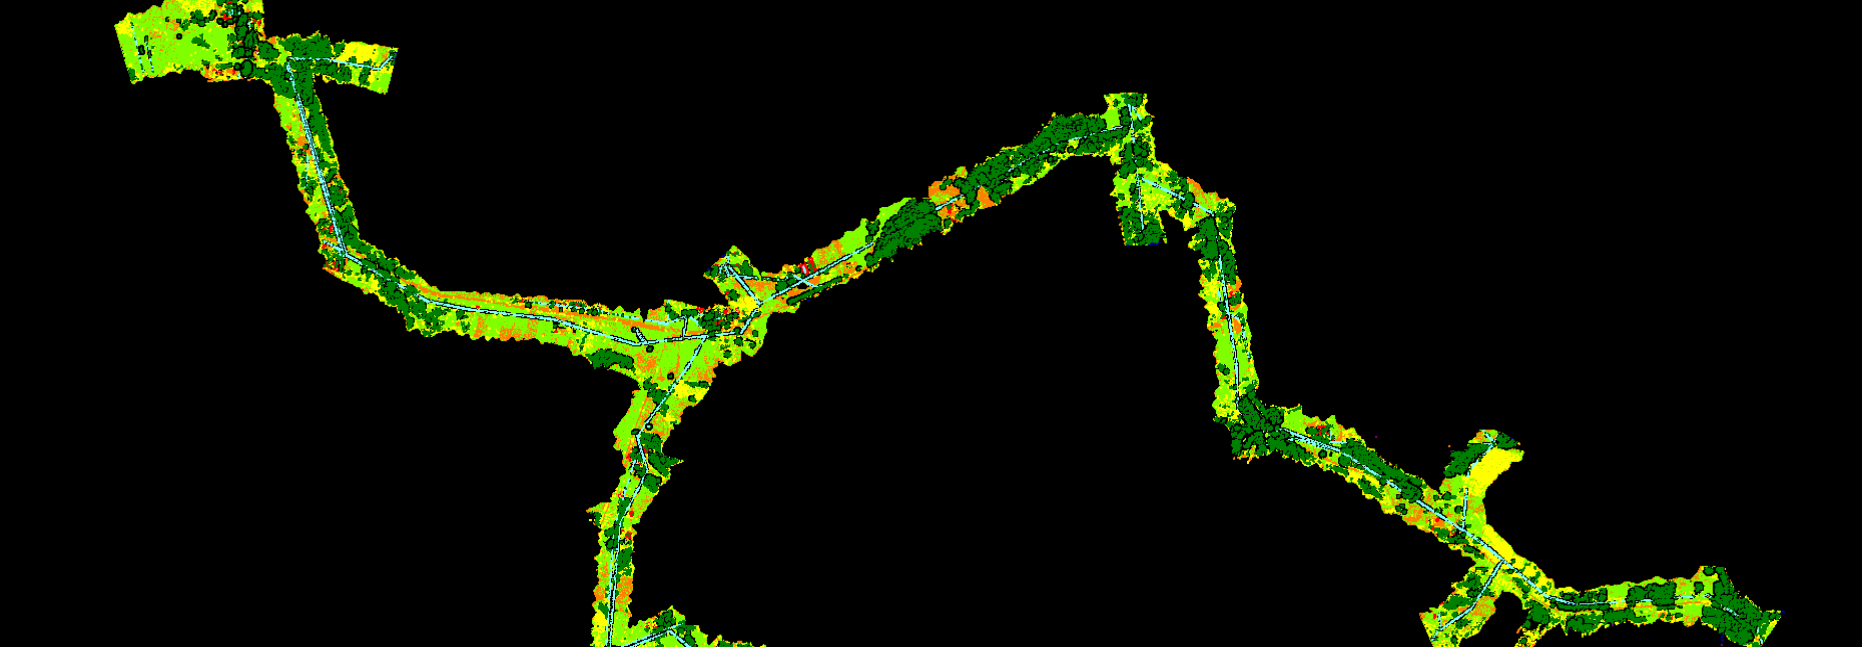
Object territory: Europe.
Average density of scanning: 18 points/m2
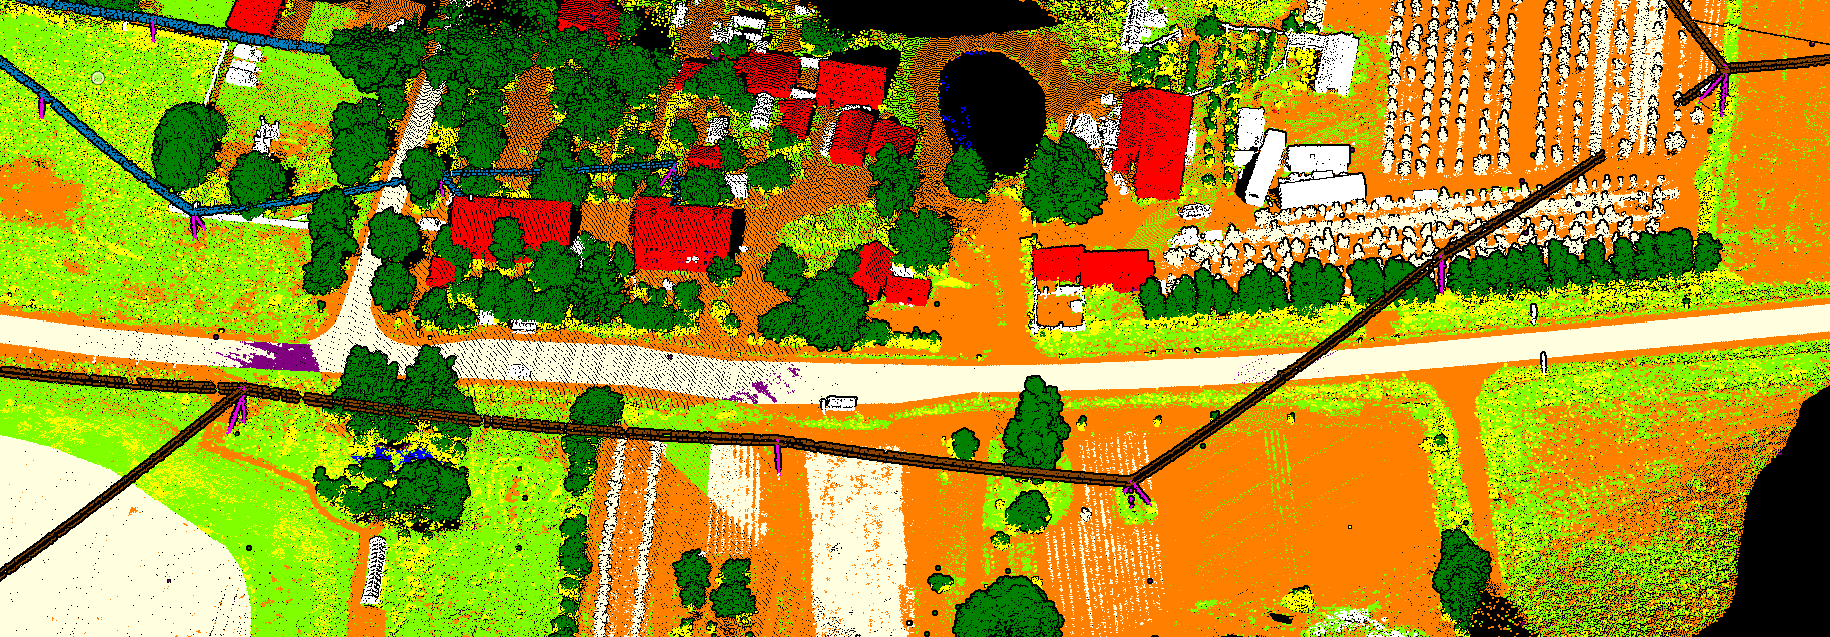
Performance specifics:
- Not classified
- Ground
- Low vegetation (0-1m)
- Middle vegetation (1-4m)
- High vegetation (>4m)
- Buildings
- Low point
- Water
- Catenary (main power line)
- Poles (main power line)
- Paved roads + parkings
- Pipeline
- Railway
- Unpaved roads + parkings
- Crossing lines L
- Crossing lines MV
- Crossing lines HV
- Crossing lines – traction
- Crossing lines – other
- Crops
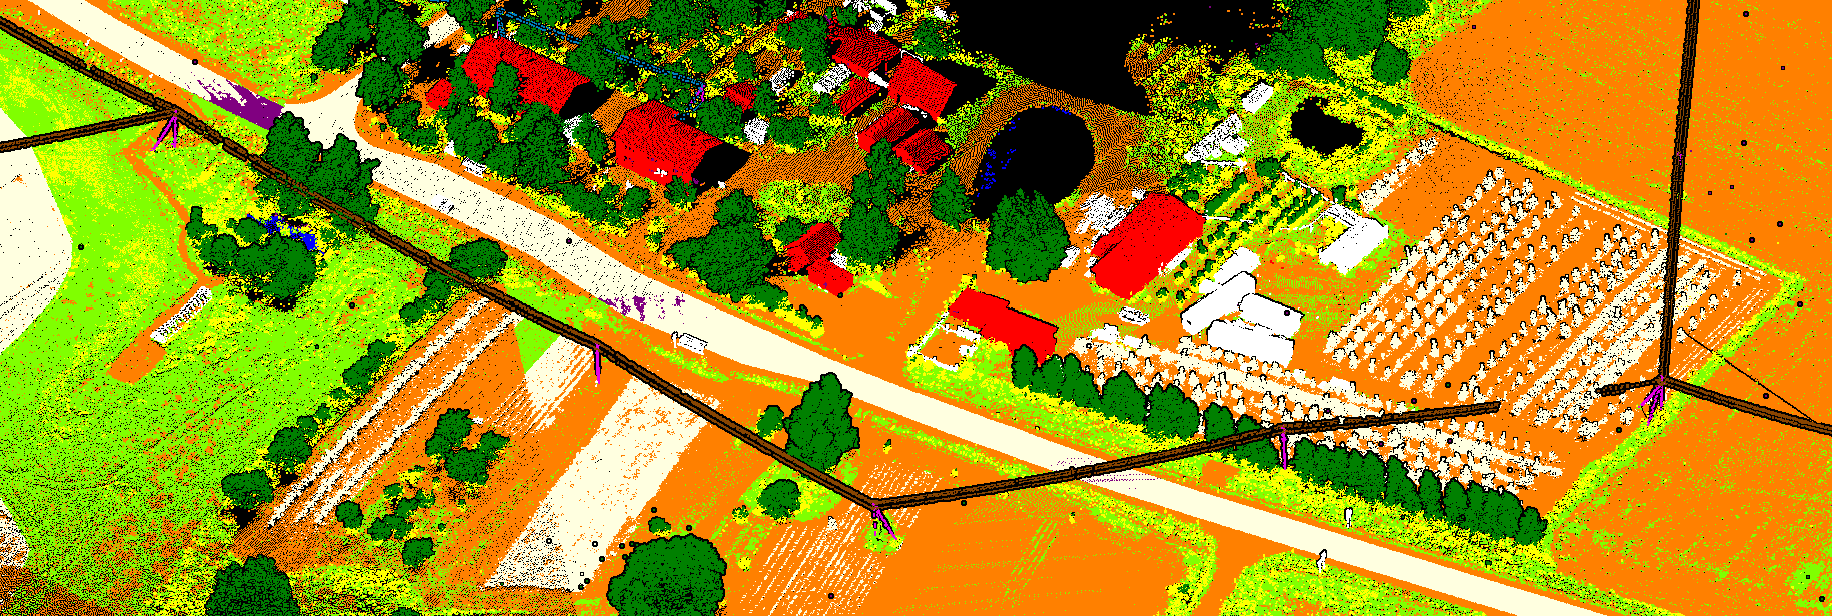
Problem and task.
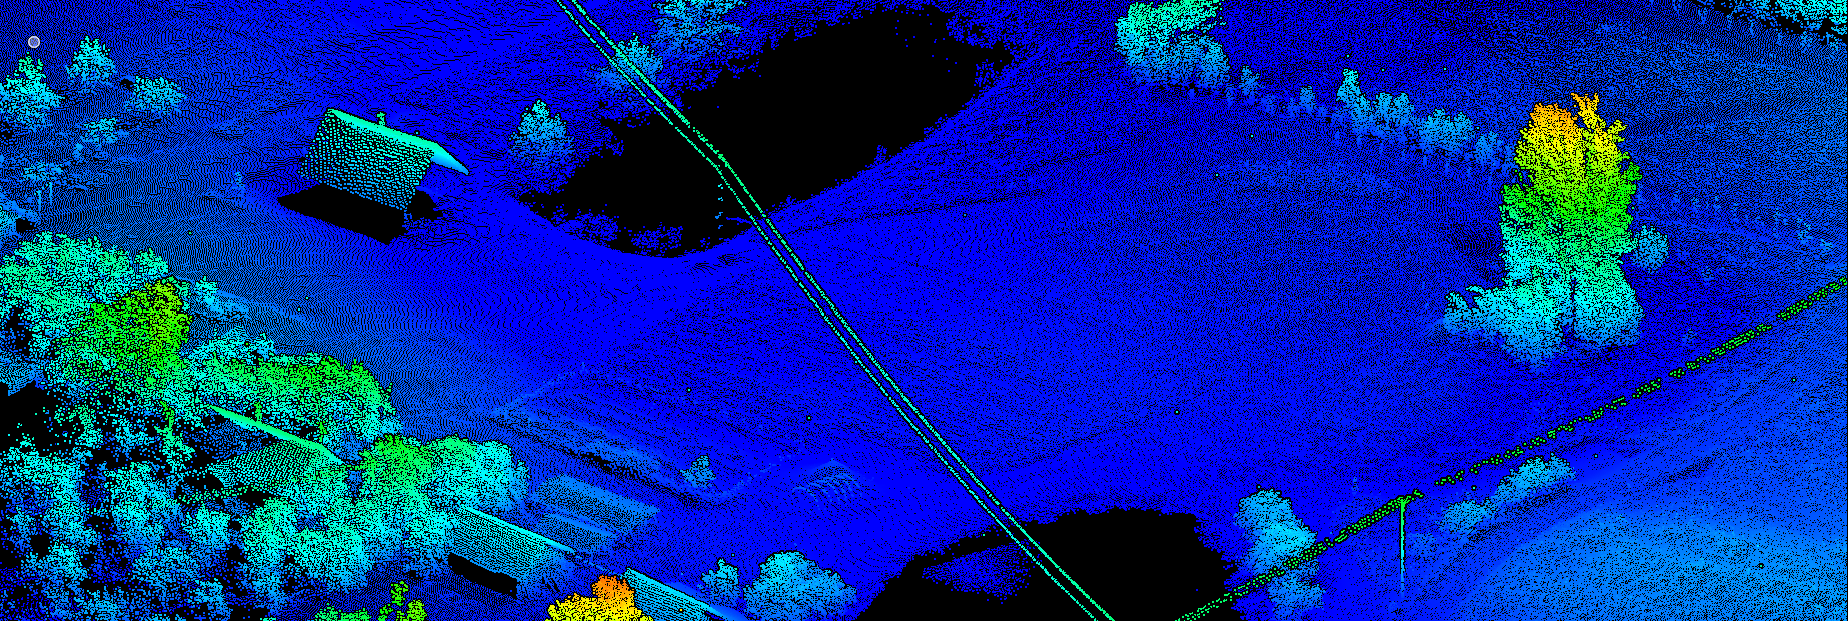
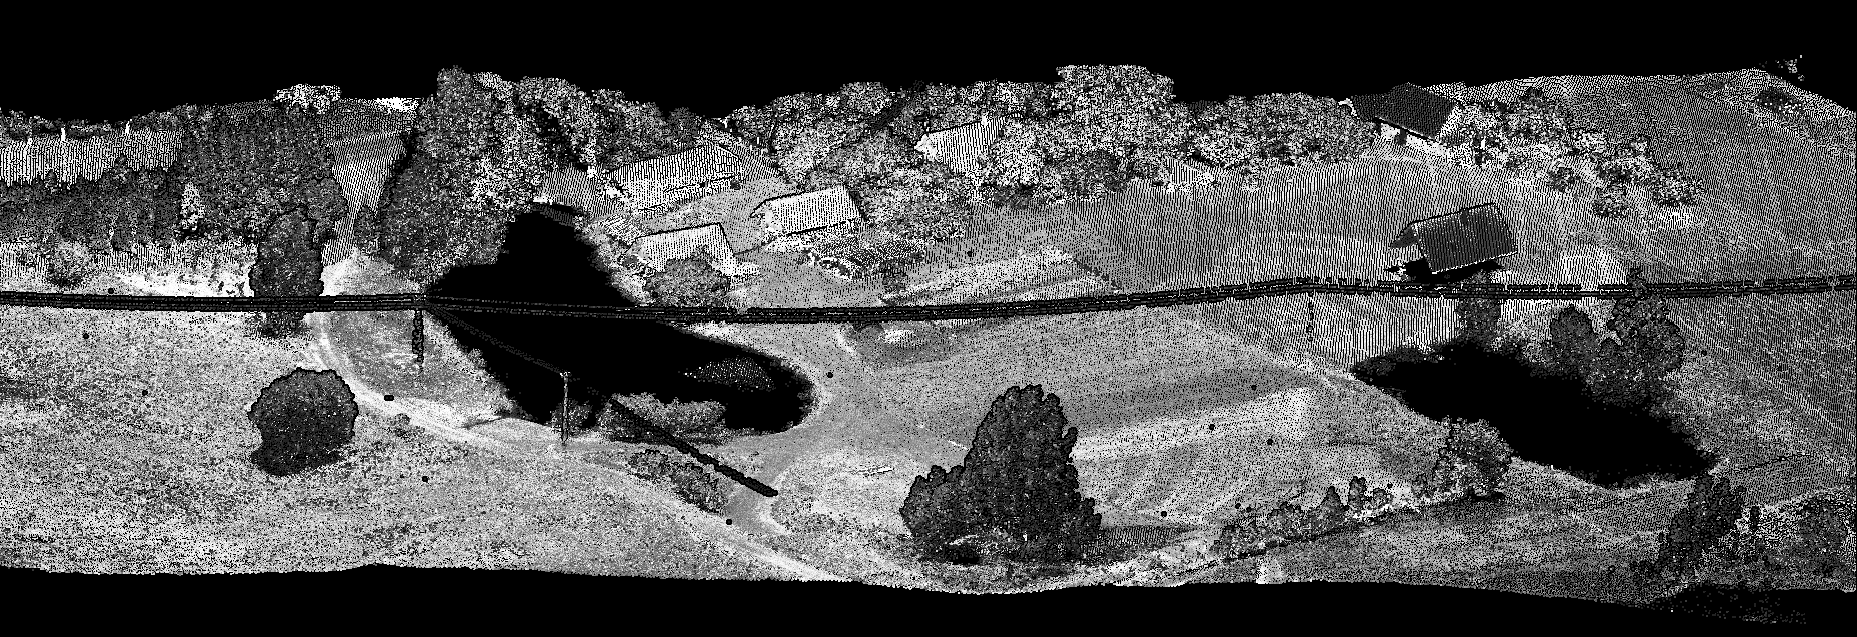
- Data Source: Helicopter-based #lidar scanning Input: Raw point clouds obtained from aerial scanning via a helicopter.
- Challenges & Tasks:
- Initial State: We received immediate post-scan LiDAR data that had overlaps and were not segmented into blocks.
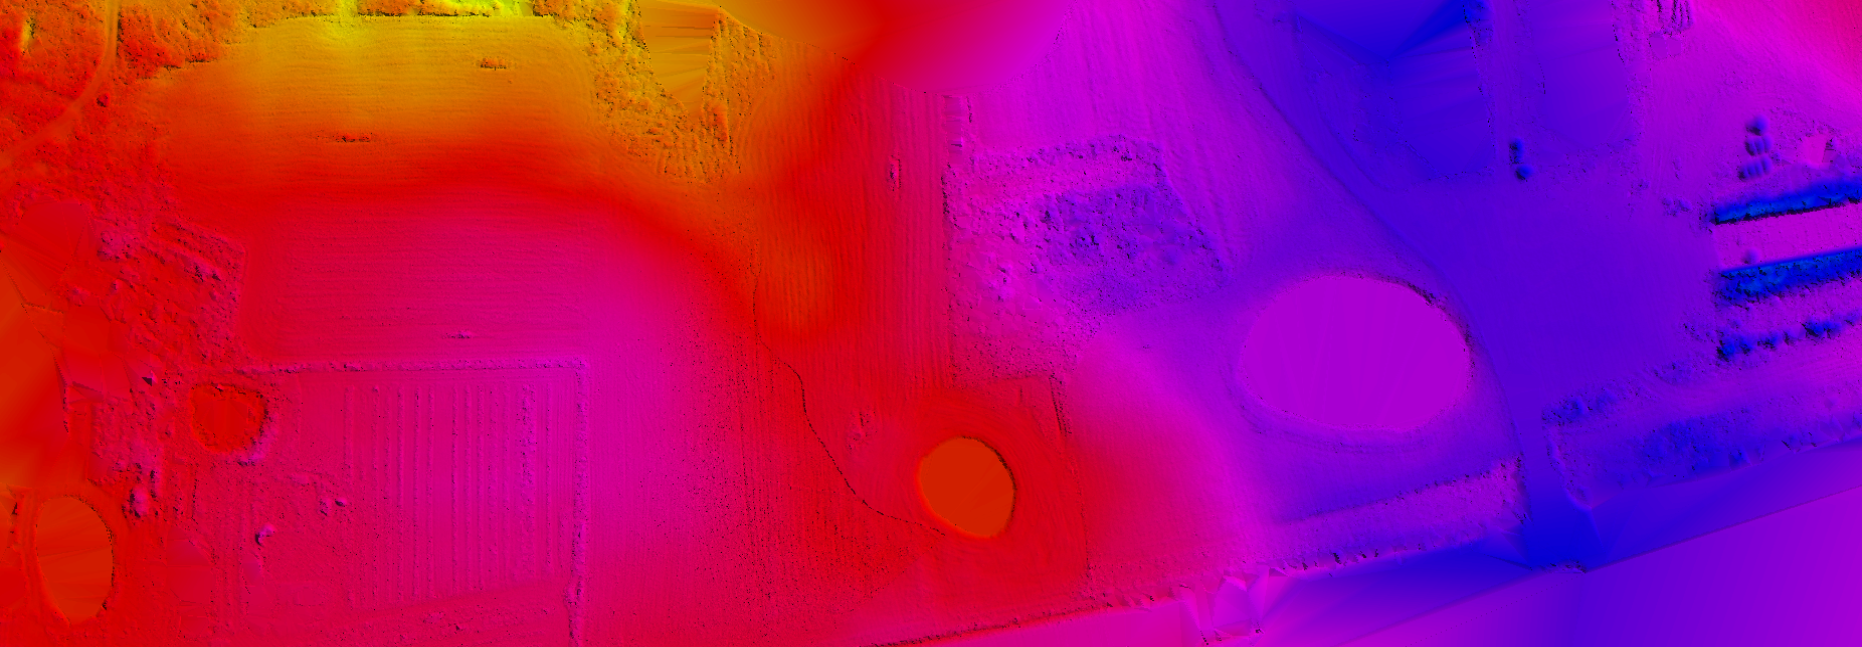
- Primary Objective: To achieve precise classification of various features such as power lines, poles, buildings, roads, agricultural fields, vegetation, and vehicles without the aid of a buffer zone. Additionally, constructing a high-quality Digital Terrain Model (#dtm) was paramount.
- Specific Consideration: Correct classification of power lines was contingent upon our understanding of their voltage levels.
- Major Hurdle: The overlapping nature of the point clouds was detrimental, especially impacting the quality of the DTM.
Look at our other power line case study here.


Realization.
1. Initial Setup and Block Division:
- Utilized the TerraScan module within Bentley Microstation to generate a vector project file (prj).
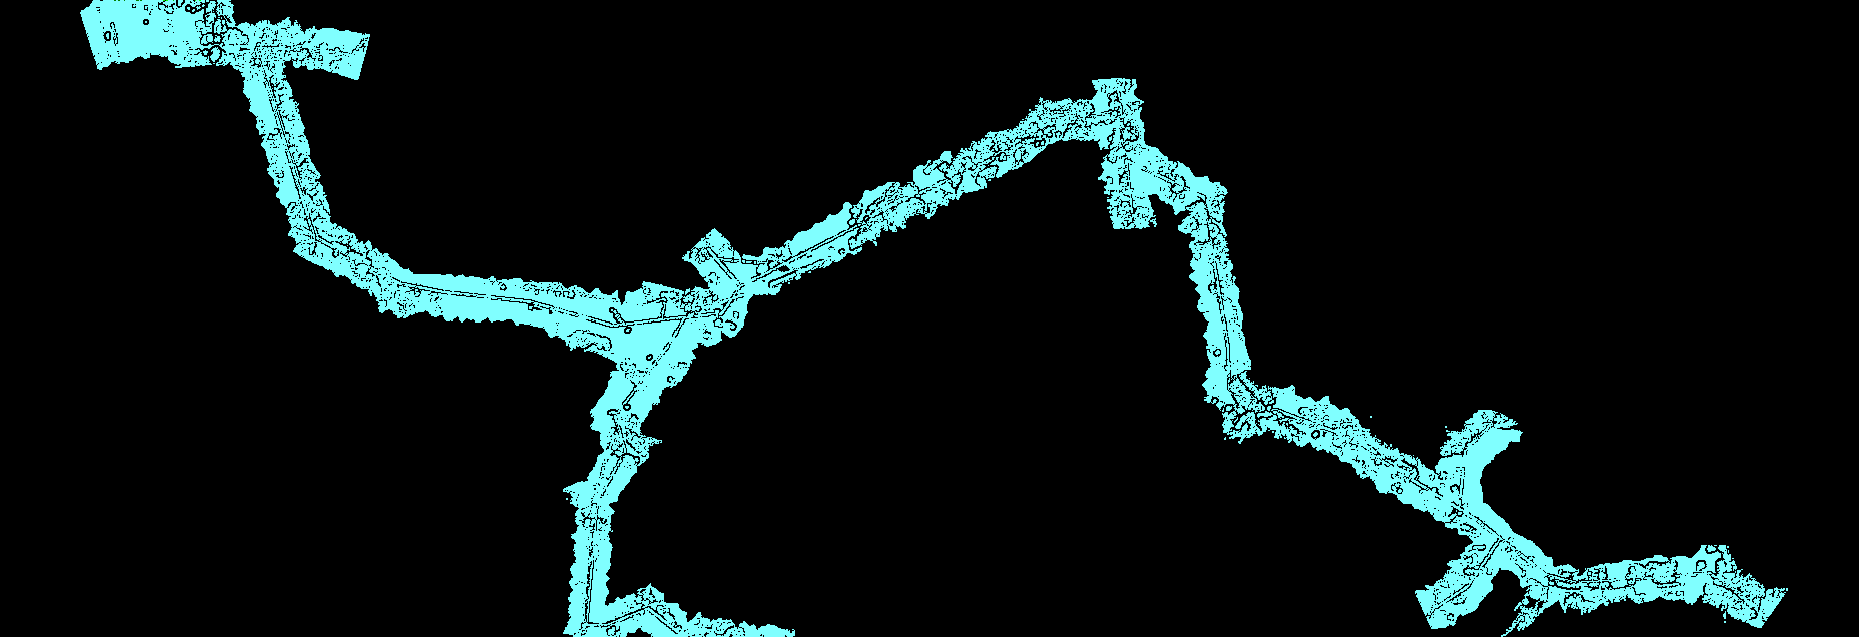
- Partitioned the entire work area into 1km^2 blocks and reorganized the points within these blocks to prevent duplication.
- Leveraged ArcPro for vector nomenclature support.
- Ensured all points were aligned with the appropriate coordinate system.
2. Macro Creation for Classification:
- Developed a macro tailored for our specific location and data to automate classification.
- The macro’s chief responsibility was the accurate differentiation of ground and vegetation classes.
3. Manual Post-Processing:
- Engaged in manual refinement, encompassing work on the DTM, power lines, poles, building facades, vegetation, roads, and water bodies.
- For road visualization, we employed a common technique: vectorizing the roads based on point intensity and subsequently reclassifying based on the resultant vectors.
- Used Google Maps as a reference to identify the placement of asphalt versus dirt roads.
4. Quality Control and Finalization:
- Reviewed point statistics across all blocks to confirm class accuracy.
- Extracted class 7 and 2 points into distinct files, ensuring power lines were absent from class 7.
- Isolated water features into a dedicated file, generated a Digital Water Model, and validated the evenness of the water surface.




Result.
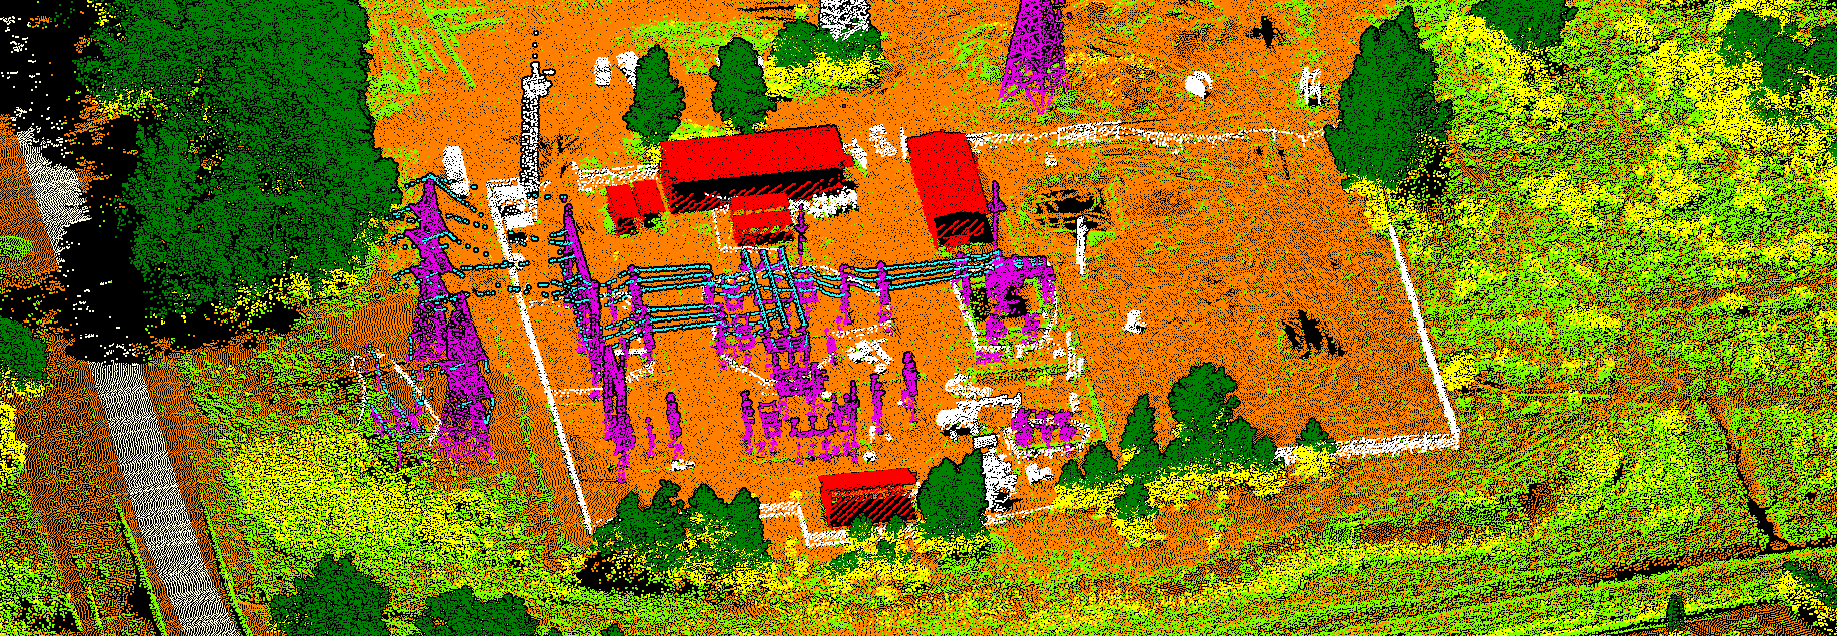
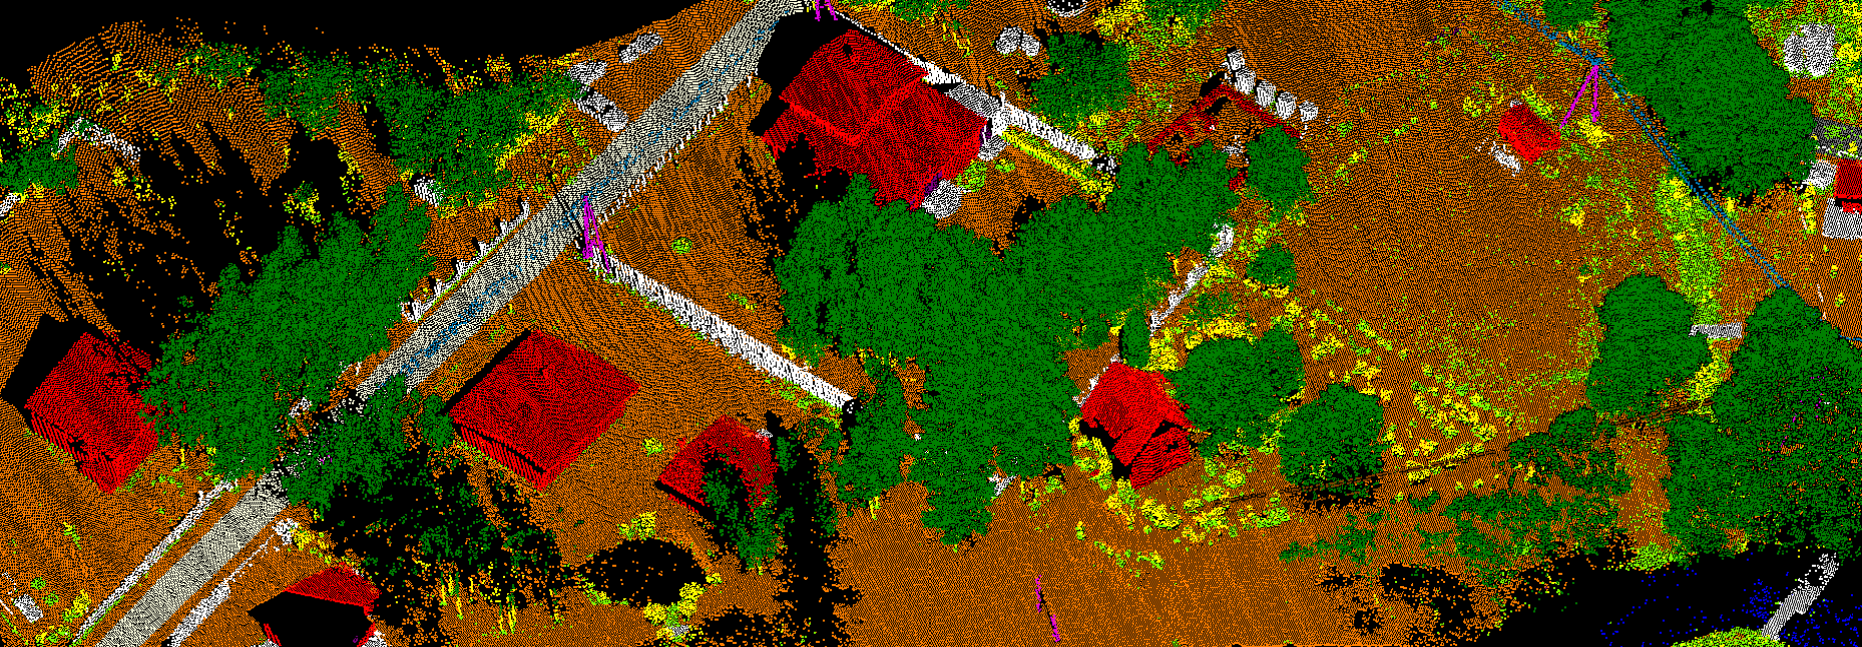
The pilot project involving the classification of raw LiDAR point clouds from aerial scanning presented several challenges, paramount among them being the overlapping point clouds which initially compromised the quality of the Digital Terrain Model (DTM). However, through a systematic and well-structured approach, these challenges were effectively addressed.
- Block Division and Duplication Elimination: The division of the entire work area into 1km2 blocks using the TerraScan module in Bentley Microstation proved instrumental. This division ensured there was no duplication of data, which is essential for maintaining the integrity and accuracy of the data.
- Macro-assisted Classification: The creation and utilization of a macro to automatically classify based on location-specific parameters streamlined the process considerably. By ensuring that ground and vegetation classes were correctly classified in this step, subsequent manual post-processing became more focused and efficient.
- Manual Post-processing & Data Integration: Even with the assistance of automation, manual post-processing remains a crucial stage. The integration of external sources like Google Maps to verify and correct classifications, especially in terms of road types, showcased the importance of cross-referencing with established datasets for improved accuracy.
- Quality Control Measures: The rigorous quality control checks, which included detailed statistics of point distribution across all blocks and segregating classes to ensure no misclassifications, underscore the commitment to ensuring the highest possible data fidelity. The additional creation of a Digital Water Model to verify water surface smoothness further demonstrates the depth of the quality assurance process.
In sum, this pilot project highlights the importance of a multi-tiered approach to LiDAR data processing, balancing both automated and manual methods, and integrating external datasets for validation. The resultant high-quality classification of features, especially critical infrastructures like power lines, roads, and buildings, confirms the efficacy of the adopted methodologies. Such a comprehensive approach ensures that the end result is not only accurate but also actionable for various applications, from infrastructure planning to environmental analysis.
We have the capacity to process over 1,000 km monthly. We’re continuously open to new projects and opportunities. Please consider sending us a pilot project to evaluate the quality of our services. Don’t hesitate to drop us a message right here.